Historical Deviation Bands
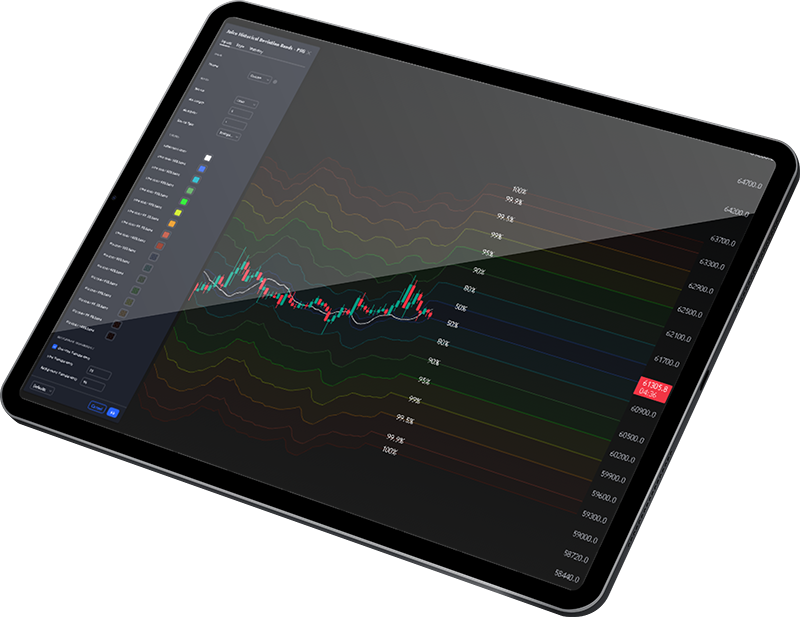
Historical Deviation Bands are a technical analysis tool used to visualize the volatility of a financial instrument over a historical period.


TPO & Volume Profile
TPO Value Areas and the TPO Point of Control to provide a comprehensive view of market activity.
Juice Remedy
Unlock the power of precision with our comprehensive suite of analytical tools. Analyze price action, visualize volume dynamics, and execute your trading strategies with confidence.


Juice Levels
These levels encompass key price points derived from various timeframes, providing crucial insights into market dynamics and potential trading opportunities.
BBWP+MAR(P)
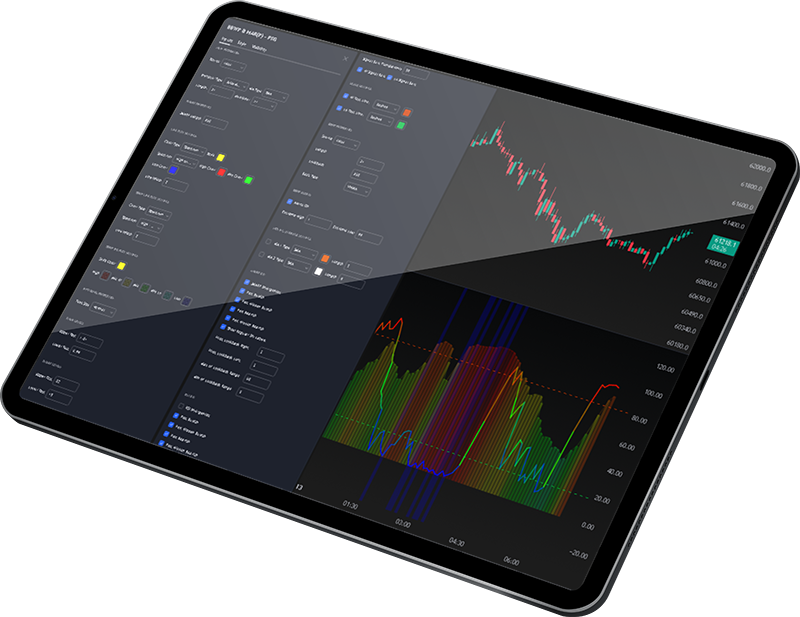
BBWP Measures the width of the Bollinger Bands relative to historical levels, indicating market volatility.
MAR(P) Compares the current price to its moving average over a specified period, assessing trend strength.


CVD & OI
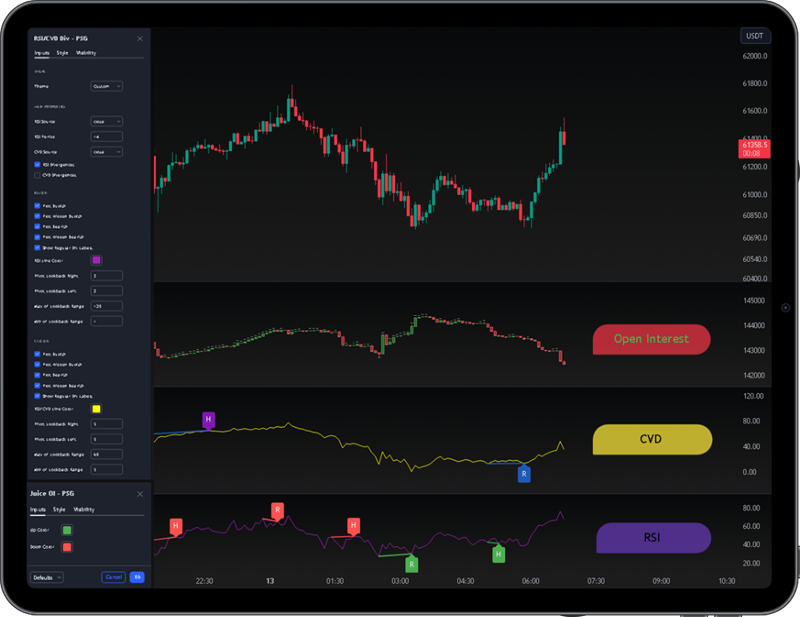
Understand the Dynamics of Cumulative Volume Delta (CVD) and Open Interest to Navigate Market Sentiment, Confirm Trends, and Identify Profitable Trading Opportunities
Fully Customizable
Enhance your user experience further by fine-tuning the layout and arrangement of elements on the screen. With the ability to rearrange, resize, and prioritize different components, you can design a layout that suits your workflow and maximizes efficiency.

