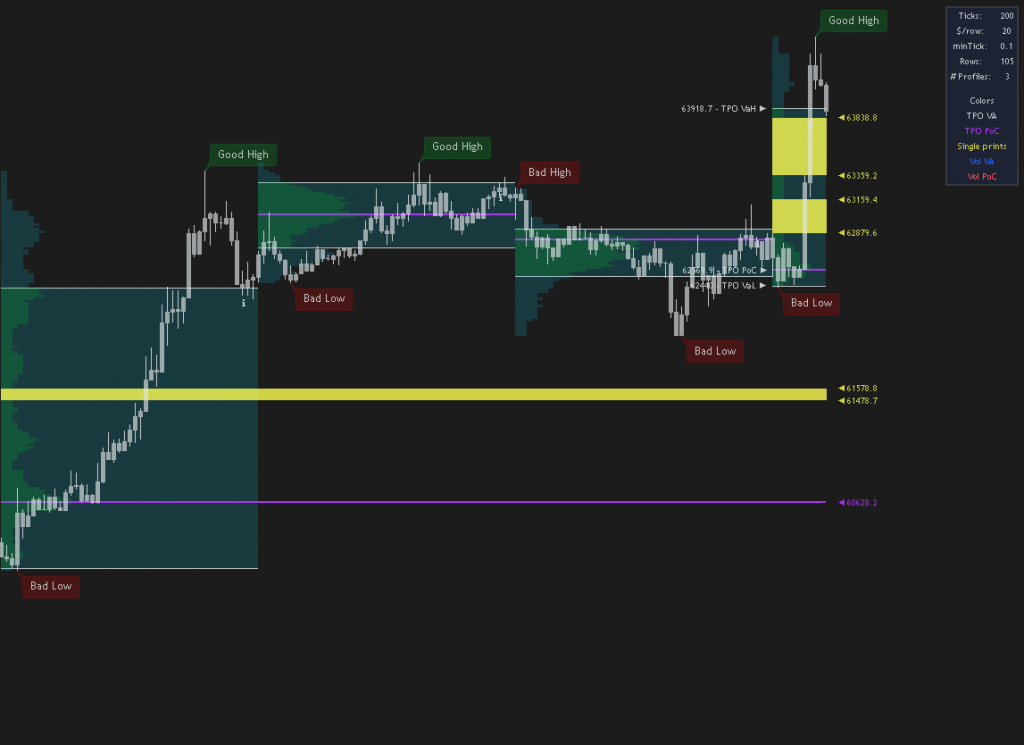
TPO & Volume Profile
The TPO & Volume uses volume data to show you how much volume was produced at a given time.
There are essential 2 indicators combined into 1.
You have the possibility to show the profile over a set period. (Default is daily).

TPO charts organize price and time into vertical columns to illustrate where trading has occurred at each price level. It provides traders with insights into market dynamics by showing the distribution of trading volume at various price levels throughout a specified period.
Key components of the TPO Profile include the Value Area, which represents the price range where a significant portion of trading volume occurred, and the Point of Control (POC), which indicates the price level with the highest trading volume.
The green bars on the left show you where the most price action occurred in the period.
The yellow bars tell you that in that region the price moved very quickly. These bars are called ‘Single Prints’.
This is often an area where price will move to on a later period.


The TPO settings will give you the possibility to change the number or rows by changing the ‘Row Size‘ setting to Manual.
Change the ‘Ticks per row‘ setting to modify the resolution. (Lower = more rows).
Ie. Bitcoin has a ticksize of 0.01.
To change every row to cover a range of $20, you’d have to change the ‘Ticks per row‘ setting to 2000.
The ‘Value Area Volume %‘ setting changes the percentage of rows that fall within the value area.
